The SWAN Instrument is designed to observe the solar Lyman alpha photons (121.6 nm) backscattered by the neutral hydrogen atoms present in the interplanetary medium. The background images show the distribution pattern of the backscattered Lyman alpha photons as observed from SOHO. This image, obtained in approximately 24 hours, is then processed to reveal spatial variations of the solar illuminating flux. These spatial variations are correlated to the actual activity on the solar disk. Because SWAN observes backscattered photons, it is actually possible to 'see' those which are originating from the farside of the Sun.

Hi-res TIF image (5.8M)
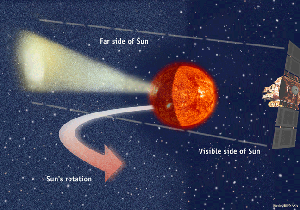
SOHO's SWAN instrument sees ultraviolet rays sweeping like a lighthouse beam across interplanetary gas beyond the Sun. The Sun takes roughly four weeks to turn completely around on its axis, but active regions can appear and grow in only a few days. So until two years ago, no one had any way of telling when an active region might come 'around the corner' -- perhaps blazing away with eruptions as soon as it appeared. If an active region can be detected in the middle of the far side it will appear on the eastern (left-hand) side of the visible disk about seven days later. The SWAN team announced the telltale ultraviolet observations in June 1999.
SWAN performs three 'full-sky' observations per week (usually on Tuesdays, Thursdays and Saturdays). Images of the solar flux spatial distribution are displayed on-line 2 to 4 days after the observation.
MAPS OF THE SOLAR LYMAN ALPHA FLUX DISTRIBUTION AS OBSERVED ON:
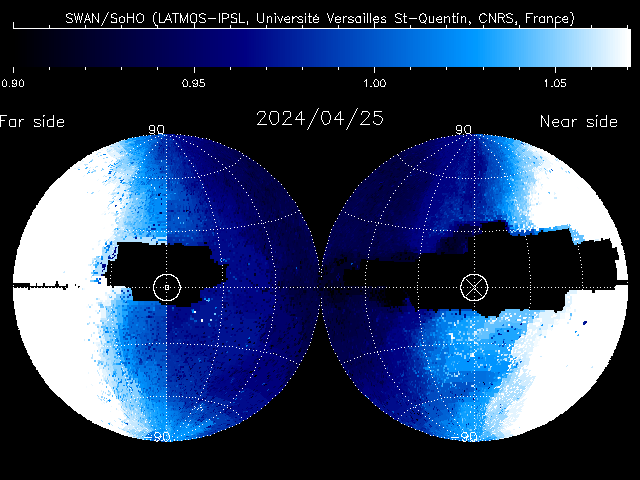
Activity on the Sun's far side (left) is revealed by the glow of hydrogen gas in space, lit by ultraviolet rays from the Sun and detected by SWAN on SOHO. It is charted as if observed from a position beyond the Sun. This view joins with a corresponding impression of near-side activity (right) to cover the whole sky. The Sun's rotation carries the activity from left to right in both images. Black areas are regions not observed by SWAN.
0000-00-00

See animation
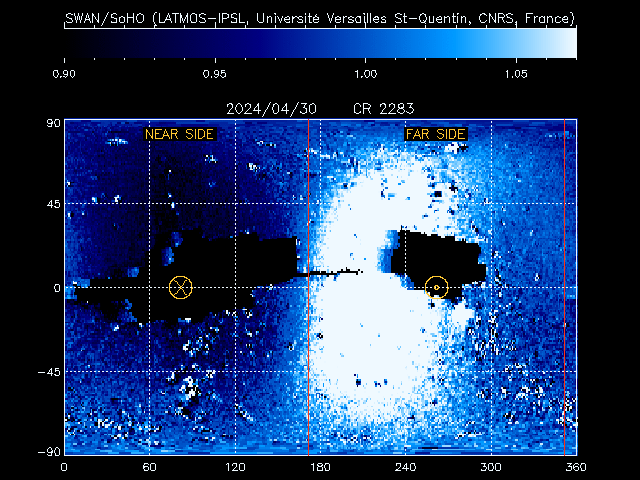
Activity on the Sun, detected as ultraviolet rays lighting up the hydrogen gas in space and seen by SWAN on SOHO, is here projected onto a map of the whole Sun including the far side. Red lines denote the far-side/near-side boundary. Active regions already observed on the near side are denoted with numbers. Black areas are regions not observed by SWAN.
COMET TRACKER'S MAPS
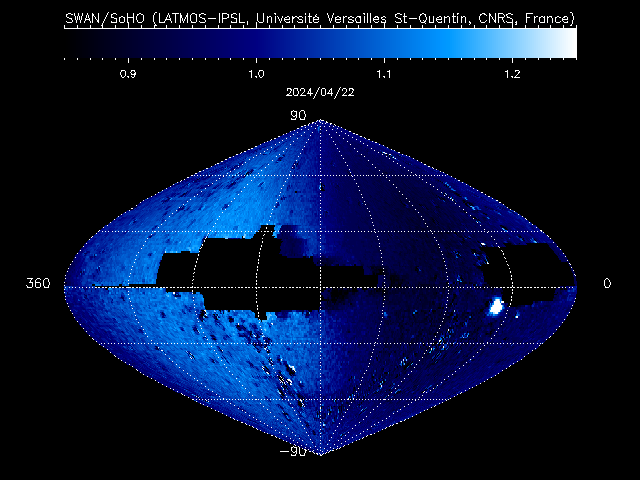
Finally, the full-sky observation images can be processed in order to reveal bright points in ultraviolet light by subtracting an average hydrogen glow. When the maps are displayed in ecliptic coordinates any point seen moving on an image sequence is potentially a comet.
0000-00-00

See animation
See also the Farside Images from SDO/HMI.
The SWAN instrument was developed in cooperation between the LATMOS (Guyancourt, France) and the Finnish Meterological Institute (Helsinki, Finland) with support from the French and Finnish space agencies. The far side image processing is funded by the french space agency, Centre National d'Etudes Spatiales.
SOHO began its Weekly Pick some time after sending a weekly image or video clip to the American Museum of Natural History (Rose Center) in New York City. There, the SOHO Weekly Pick is displayed with some annotations on a large plasma display.
If your institution would also like to receive the same Weekly Pick from us for display (usually in Photoshop or QuickTime format), please send your inquiry to steele.hill@gsfc.nasa.gov.


