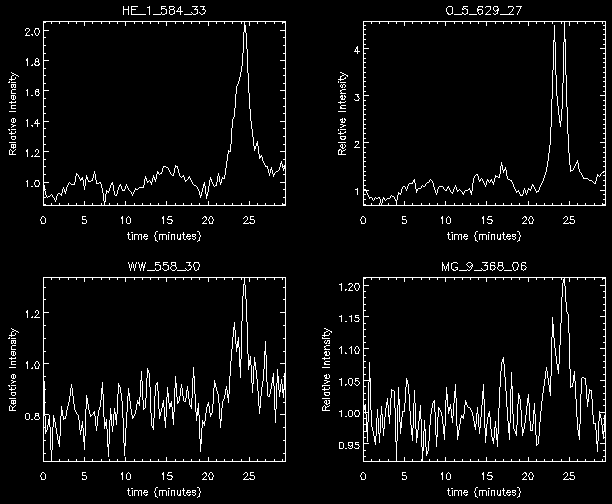
These plots were formed by looking at one particular position on the Sun and plotting the intensity relative to its initial value. The whole event is co-temporal in all lines and lasts from about the 22nd minute to the 27th minute. Just past the 24th minute, the He I intensity peaks at just over twice the initial intensity. The O V plot is even more interesting, showing not only a huge increase in intensity but also clear evidence of a well resolved double peak. This double peak feature is also evident in the hotter WW and Mg IX, although this time the change in intensity peaks at around 20%. Clearly the `active region blinker' can influence the solar atmosphere across a wide range of temperatures.