Solar Eruption Dynamics
>Click on the images for larger/full field versions. |
|
 |
 |
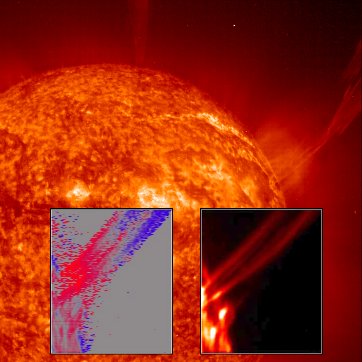
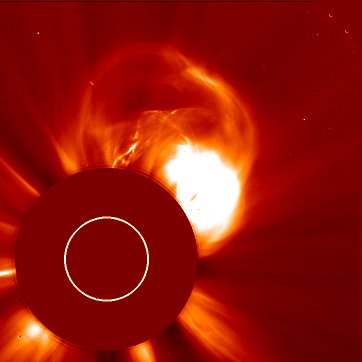
Caption: Although large filament eruptions are not unusual close to solar maximum, this one highlights some of the mutually complementary strengths of different instruments onboard SOHO.
EIT and LASCO are imaging instruments, with large fields of view, providing excellent images and movies of dynamic events. However, their diagnostic capabilities are limited in terms of line-of-sight velocities and temperatures. Spectrometers, on the other hand, have much better diagnostic capabilities, but small instantaneous fields of view, and slower cadence to capture dynamic events. Typically, they must build up images by scanning a slit back and forth, capturing detailed information about emission lines that yield a wealth of information about the objects under scrutiny.
Spectroscopic observations, made in concert with the high resolution imaging, can provide details of conditions in the solar atmosphere. As with weather maps, we are able to determine temperatures, densities, flow speeds and even what the gases are made of. For instance observations of the velocity of gases in the solar atmosphere are made by the Doppler effect - the same principles as that used by police radars to detect speeding motorists or by meteorology Doppler radars to track the movements of clouds and rain.
The images and movies above show a large eruption that took place on 14 January. The CDS instrument was fortunate enough to capture an image of the footpoints of the filament just as the eruption was underway. The insets in the EIT He I 304 Å image show the intensities and velocities of material emitting in the O V 629 Å emission line (from 4 times ionized oxygen). Material moving towards the observer is shown as blue in the velocity map, and material moving away is shown as red. Gray areas have either zero velocities or too weak signal to detect any velocities. Although only a preliminary analysis has been performed, the velocity map seems to suggest a rotational movement in the footpoints.
Instruments: Coronal Diagnostic Spectrometer (CDS); Extreme ultraviolet
Imaging Telescope (EIT); Large Angle Spectrometric Coronagraph (LASCO);
Taken: 14 January 2001.
Picture credit: SOHO/CDS, SOHO/EIT, and SOHO/LASCO (ESA & NASA)


